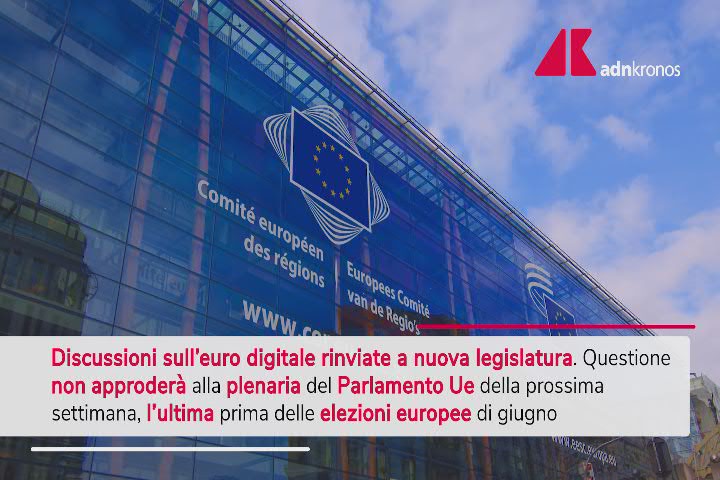
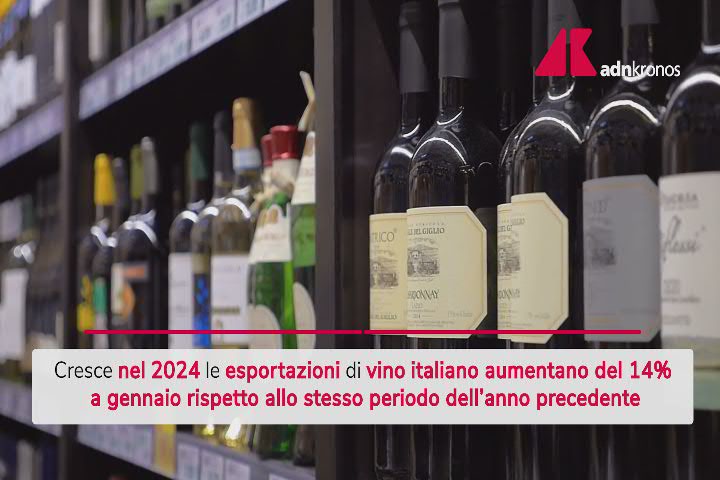
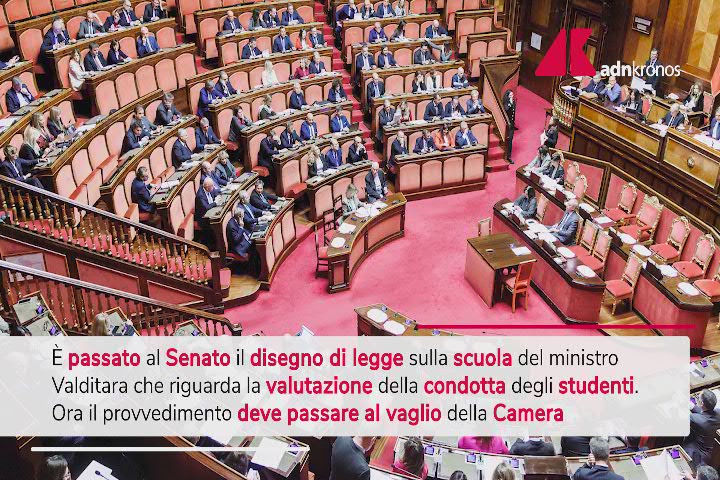
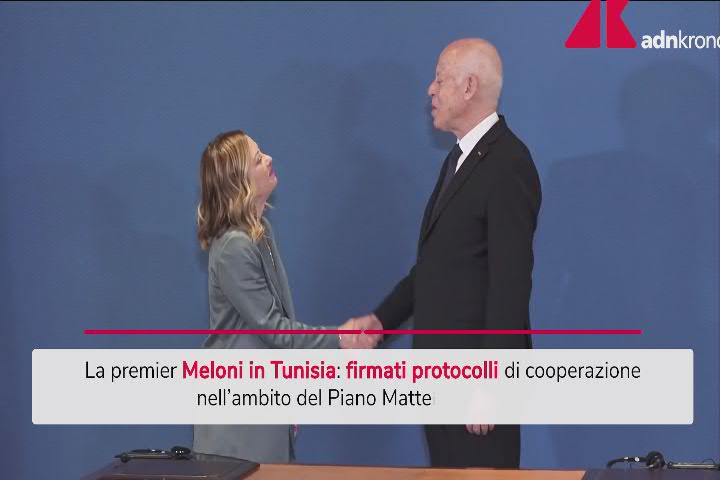
Transformation strategy gains traction
Net Revenue of $110 million increases 22% over Q1 FY20
Net Loss of $128 million; Adjusted EBITDA loss of $92 million narrows versus Q1 FY20
Established leadership position in growing cannabis-infused beverage segment; shipping +1.2mm cans to Canadian provinces since launch
Strengthened foothold in U.S. market with launch of shopcanopy.com
SMITHS FALLS, Ontario, Aug. 10, 2020 /PRNewswire/ -- Canopy Growth Corporation ("Canopy Growth" or the "Company") (TSX: WEED) (NYSE: CGC) today announced its financial results for the first quarter fiscal 2021 ended June 30, 2020. All financial information in this press release is reported in millions of Canadian dollars, unless otherwise indicated.
"We're proud of our strong first-quarter performance, despite unprecedented volatility and uncertainty in the market and across the globe," said David Klein, CEO. "We grew our revenue year-over-year and are seeing market share improvement, notably achieving number one market share in cannabis-infused beverages in the Canadian market. We are implementing a renewed corporate strategy with the appointment of a new leadership team which will focus on delivering quality products to our consumers, positioning our business for continued growth. The proposed retooled Acreage announcement refocuses our entry for the evolving U.S. market, where we are seeing increased momentum."
"Following our previously announced restructuring actions, we have substantially reduced our expense and cash burn in this quarter in addition to reducing headcount by over 18% since beginning of this calendar year. Our marketing and R&D investments are being re-allocated to programs with high-return potential in order to drive sales," added Mike Lee, CFO. "Our gross margins in the quarter came in below our expectations due to under-utilization of our large-scale infrastructure. We've already proven we can deliver 40%-plus gross margin and are confident that we can return to that level as we work toward higher capacity utilization across our facilities as demand for our cannabis products continue to grow. In the meantime, we are focused on further optimizing our operating footprint through a full end-to-end strategy that looks at people, process, technology, and infrastructure that we believe will lead to best in class margins over time."
First Quarter Fiscal 2021 Financial Summary
|
Net revenue |
Gross margin percentage |
Adjustedgross margin percentage1 |
Net loss |
Adjusted EBITDA2 |
Free cashflow3 |
|
|
Reported |
$110.4 |
6% |
7% |
$(128.3) |
$(92.2) |
$(180.1) |
|
vs. Q1 2020 |
22% |
(1,400) bps |
(1,300 bps) |
34% |
1% |
51% |
|
1 Adjusted gross margin percentage is a non-GAAP measure. See "Non-GAAP Measures". |
||||||
|
2 Adjusted EBITDA is a non-GAAP measure. See "Non-GAAP Measures". |
||||||
|
3 Free cash flow is a non-GAAP measure. See "Non-GAAP Measures". |
||||||
First Quarter Fiscal 2021 Corporate Financial Highlights
3Business & Operational Highlights
First Quarter Fiscal 2021 Financial and Operational Review
Revenue by Channel
|
(in millions of Canadian dollars, unaudited) |
Q1 2021 |
Q1 2020 |
vs. Q1 2020 |
|
Canadian recreational net revenue |
|||
|
- Business to business1 |
$34.9 |
$38.9 |
(10%) |
|
- Business to consumer |
$9.3 |
$10.6 |
(12%) |
|
Canadian recreational net revenue |
$44.2 |
$49.5 |
(11%) |
|
Canadian medical net revenue2 |
$13.9 |
$11.7 |
19% |
|
International medical revenue |
$20.2 |
$10.5 |
92% |
|
All other revenue |
$32.1 |
$18.8 |
71% |
|
Net revenue |
$110.4 |
$90.5 |
22% |
|
1 Includes excise taxes of $7.2 million (Q1 2020 - $11.5 million). |
|||
|
2 Includes excise taxes of $1.4 million (Q1 2020 - $1.4 million). |
|||
Revenue by Form
|
(in millions of Canadian dollars, unaudited) |
Q1 2021 |
Q1 2020 |
vs. Q1 2020 |
|
Canadian recreational revenue |
|||
|
- Dry bud1 |
$40.1 |
$60.8 |
(34%) |
|
- Oils and softgels1 |
$7.7 |
$8.2 |
(6%) |
|
- Cannabis 2.0 products2 |
$7.0 |
$- |
NM |
|
- Other revenue adjustments3 |
$(3.4) |
$(8.0) |
58% |
|
- Excise taxes |
$(7.2) |
$(11.5) |
37% |
|
$44.2 |
$49.5 |
(11%) |
|
|
Global medical revenue |
|||
|
- Dry bud |
$10.2 |
$7.2 |
42% |
|
- Oils and softgels |
$25.0 |
$16.4 |
52% |
|
- Cannabis 2.0 products2 |
$0.3 |
$- |
NM |
|
- Excise taxes |
$(1.4) |
$(1.4) |
0% |
|
$34.1 |
$22.2 |
54% |
|
|
All other revenue |
$32.1 |
$18.8 |
71% |
|
Net revenue |
$110.4 |
$90.5 |
22% |
|
1 Excludes the impact of other revenue adjustments. |
|||
|
2 Cannabis 2.0 products include cannabis-infused chocolates, cannabis-infused beverages, and cannabis vape products (including power sources such as rechargeable and compact batteries, ready-to-go vape pens, and cartridges/vape pods) |
|||
|
3 Other revenue adjustments represent the Company's determination of returns and pricing adjustments, and relate to the Canadian recreational business-to-business channel. |
Canadian Cannabis
International Cannabis
3 33Strategic Acquisitions
The first quarter fiscal 2021 and first quarter fiscal 2020 financial results presented in this press release have been prepared in accordance with U.S. GAAP.
Webcast and Conference Call Information
The Company will host a conference call and audio webcast with David Klein, CEO and Mike Lee, CFO at 10:00 AM Eastern Time on August 10, 2020.
Webcast Information
A live audio webcast will be available at:https://produceredition.webcasts.com/starthere.jsp?ei=1343663&tp_key=96c72fd568
Replay Information
A replay of the call will be accessible by webcast, until 11:59 PM ET on November 8, 2020, at https://produceredition.webcasts.com/starthere.jsp?ei=1343663&tp_key=96c72fd568
Non-GAAP Measures
Adjusted EBITDA is a non-GAAP measure used by management that is not defined by U.S. GAAP and may not be comparable to similar measures presented by other companies. Adjusted EBITDA is calculated as the reported net loss, adjusted to exclude income tax recovery (expense); other income (expense), net; loss on equity method investments; share-based compensation expense; depreciation and amortization expense; asset impairment and restructuring costs; and charges related to the flow-through of inventory step-up on business combinations, and further adjusted to remove acquisition-related costs. The Adjusted EBITDA reconciliation is presented within this news release and explained in the Company's Quarterly Report on Form 10-Q to be filed with the SEC.
Adjusted Gross Margin and Adjusted Gross Margin Percentage are non-GAAP measures used by management that are not defined by U.S. GAAP and may not be comparable to similar measures presented by other companies. Adjusted Gross Margin is calculated as gross margin excluding charges related to the flow-through of inventory step-up associated with business combinations. Adjusted Gross Margin Percentage is calculated as Adjusted Gross Margin divided by Net Revenue. The Adjusted Gross Margin reconciliation is presented within this news release.
Free Cash Flow is a non- GAAP measure used by management that is not defined by U.S. GAAP and may not be comparable to similar measures presented by other companies. This measure is calculated as net cash provided by (used in) operating activities less purchases of and deposits on property, plant and equipment. The Free Cash Flow reconciliation is presented within this news release and explained in the Company's Quarterly Report on Form 10-Q to be filed with the SEC.
About Canopy Growth Corporation
Canopy Growth (TSX:WEED, NYSE:CGC) is a world-leading diversified cannabis, hemp and cannabis device company, offering distinct brands and curated cannabis varieties in dried, oil and Softgel capsule forms, as well as medical devices through the Company's subsidiary, Storz & Bickel GMbH & Co. KG. From product and process innovation to market execution, Canopy Growth is driven by a passion for leadership and a commitment to building a world-class cannabis company one product, site and country at a time.
The Company's medical division, Spectrum Therapeutics is proudly dedicated to educating healthcare practitioners, conducting robust clinical research, and furthering the public's understanding of cannabis, and has devoted millions of dollars toward cutting edge, commercializable research and IP development. Spectrum Therapeutics sells a range of full-spectrum products using its colour-coded classification Spectrum system as well as single cannabinoid Dronabinol under the brand Bionorica Ethics.
The Company operates retail stores across Canada under its award-winning Tweed and Tokyo Smoke banners. Tweed is a globally recognized cannabis brand which has built a large and loyal following by focusing on quality products and meaningful customer relationships.
From our public listing on the Toronto Stock Exchange and New York Stock Exchange to our continued international expansion, pride in advancing shareholder value through leadership is engrained in all we do at Canopy Growth. Canopy Growth has established partnerships with leading sector names including cannabis icons Snoop Dogg and Seth Rogen, breeding legends DNA Genetics and Green House Seeds, and Fortune 500 alcohol leader Constellation Brands, to name but a few. For more information visit www.canopygrowth.com.
Notice Regarding Forward Looking Statements
This press release contains "forward-looking statements" within the meaning of applicable securities laws, which involve certain known and unknown risks and uncertainties. Forward-looking statements predict or describe our future operations, business plans, business and investment strategies and the performance of our investments. These forward-looking statements are generally identified by their use of such terms and phrases as "intend," "goal," "strategy," "estimate," "expect," "project," "projections," "forecasts," "plans," "seeks," "anticipates," "potential," "proposed," "will," "should," "could," "would," "may," "likely," "designed to," "foreseeable future," "believe," "scheduled" and other similar expressions. Our actual results or outcomes may differ materially from those anticipated. You are cautioned not to place undue reliance on these forward-looking statements, which speak only as of the date the statement was made.
Forward-looking statements include, but are not limited to, statements with respect to:
Certain of the forward-looking statements contained herein concerning the industries in which we conduct our business are based on estimates prepared by us using data from publicly available governmental sources, market research, industry analysis and on assumptions based on data and knowledge of these industries, which we believe to be reasonable. However, although generally indicative of relative market positions, market shares and performance characteristics, such data is inherently imprecise. The industries in which we conduct our business involve risks and uncertainties that are subject to change based on various factors, which are described further below.
The forward-looking statements contained herein are based upon certain material assumptions that were applied in drawing a conclusion or making a forecast or projection, including: (i) management's perceptions of historical trends, current conditions and expected future developments; (ii) our ability to generate cash flow from operations; (iii) general economic, financial market, regulatory and political conditions in which we operate; (iv) the production and manufacturing capabilities and output from our facilities and our joint ventures, strategic alliances and equity investments; (v) consumer interest in our products; (vi) competition; (vii) anticipated and unanticipated costs; (viii) government regulation of our activities and products including but not limited to the areas of taxation and environmental protection; (ix) the timely receipt of any required regulatory authorizations, approvals, consents, permits and/or licenses; (x) our ability to obtain qualified staff, equipment and services in a timely and cost-efficient manner; (xi) our ability to conduct operations in a safe, efficient and effective manner; (xii) our ability to realize anticipated benefits, synergies or generate revenue, profits or value from our recent acquisitions into our existing operations; (xiii) our ability to continue to operate in light of the COVID-19 pandemic and the impact of the pandemic on demand for, and sales of, our products and our distribution channels; and (xiv) other considerations that management believes to be appropriate in the circumstances. While our management considers these assumptions to be reasonable based on information currently available to management, there is no assurance that such expectations will prove to be correct.
By their nature, forward-looking statements are subject to inherent risks and uncertainties that may be general or specific and which give rise to the possibility that expectations, forecasts, predictions, projections or conclusions will not prove to be accurate, that assumptions may not be correct and that objectives, strategic goals and priorities will not be achieved. A variety of factors, including known and unknown risks, many of which are beyond our control, could cause actual results to differ materially from the forward-looking statements in this press release and other reports we file with, or furnish to, the Securities and Exchange Commission (the "SEC") and other regulatory agencies and made by our directors, officers, other employees and other persons authorized to speak on our behalf. Such factors include, without limitation, the risk that the COVID-19 pandemic may disrupt our operations and those of our suppliers and distribution channels and negatively impact the use of our products; consumer demand for cannabis and U.S. hemp products; that cost savings and any other synergies from the CBI Group Investments may not be fully realized or may take longer to realize than expected; future levels of revenues; our ability to manage disruptions in credit markets or changes to our credit rating; future levels of capital, environmental or maintenance expenditures, general and administrative and other expenses; the success or timing of completion of ongoing or anticipated capital or maintenance projects; business strategies, growth opportunities and expected investment; the adequacy of our capital resources and liquidity, including but not limited to, availability of sufficient cash flow to execute our business plan (either within the expected timeframe or at all); the potential effects of judicial or other proceedings on our business, financial condition, results of operations and cash flows; volatility in and/or degradation of general economic, market, industry or business conditions; compliance with applicable environmental, economic, health and safety, energy and other policies and regulations and in particular health concerns with respect to vaping and the use of cannabis and U.S. hemp products in vaping devices; the anticipated effects of actions of third parties such as competitors, activist investors or federal, state, provincial, territorial or local regulatory authorities, self-regulatory organizations, plaintiffs in litigation or persons threatening litigation; changes in regulatory requirements in relation to our business and products; and the factors discussed under the heading "Risk Factors" in the Company's Annual Report on Form 10-K for the year ended March 31, 2020 filed with the SEC on June 1, 2020. Readers are cautioned to consider these and other factors, uncertainties and potential events carefully and not to put undue reliance on forward-looking statements.
Forward-looking statements are provided for the purposes of assisting the reader in understanding our financial performance, financial position and cash flows as of and for periods ended on certain dates and to present information about management's current expectations and plans relating to the future, and the reader is cautioned that the forward-looking statements may not be appropriate for any other purpose. While we believe that the assumptions and expectations reflected in the forward-looking statements are reasonable based on information currently available to management, there is no assurance that such assumptions and expectations will prove to have been correct. Forward-looking statements are made as of the date they are made and are based on the beliefs, estimates, expectations and opinions of management on that date. We undertake no obligation to update or revise any forward-looking statements, whether as a result of new information, estimates or opinions, future events or results or otherwise or to explain any material difference between subsequent actual events and such forward-looking statements, except as required by law. The forward-looking statements contained in this press release and other reports we file with, or furnish to, the SEC and other regulatory agencies and made by our directors, officers, other employees and other persons authorized to speak on our behalf are expressly qualified in their entirety by these cautionary statements.
Schedule 1
|
CANOPY GROWTH CORPORATION CONDENSED INTERIM CONSOLIDATED BALANCE SHEETS (in thousands of Canadian dollars, except number of shares and per share data, unaudited) |
||||
|
June 30, 2020 |
March 31, 2020 |
|||
|
ASSETS |
||||
|
Current assets: |
||||
|
Cash and cash equivalents |
$975,870 |
$1,303,176 |
||
|
Short-term investments |
1,060,901 |
673,323 |
||
|
Restricted short-term investments |
16,436 |
21,539 |
||
|
Amounts receivable, net |
72,578 |
90,155 |
||
|
Inventory |
389,800 |
391,086 |
||
|
Prepaid expenses and other assets |
98,362 |
85,094 |
||
|
Total current assets |
2,613,947 |
2,564,373 |
||
|
Equity method investments |
58,654 |
65,843 |
||
|
Other financial assets |
273,624 |
249,253 |
||
|
Property, plant and equipment |
1,508,668 |
1,524,803 |
||
|
Intangible assets |
444,199 |
476,366 |
||
|
Goodwill |
1,929,418 |
1,954,471 |
||
|
Other assets |
17,320 |
22,636 |
||
|
Total assets |
$6,845,830 |
$6,857,745 |
||
|
LIABILITIES AND SHAREHOLDERS' EQUITY |
||||
|
Current liabilities: |
||||
|
Accounts payable |
$89,368 |
$123,393 |
||
|
Other accrued expenses and liabilities |
82,981 |
64,994 |
||
|
Current portion of long-term debt |
22,570 |
16,393 |
||
|
Other liabilities |
124,757 |
215,809 |
||
|
Total current liabilities |
319,676 |
420,589 |
||
|
Long-term debt |
477,836 |
449,022 |
||
|
Deferred income tax liabilities |
45,816 |
47,113 |
||
|
Liability arising from Acreage Arrangement |
285,000 |
250,000 |
||
|
Warrant derivative liability |
287,122 |
322,491 |
||
|
Other liabilities |
168,239 |
190,660 |
||
|
Total liabilities |
1,583,689 |
1,679,875 |
||
|
Commitments and contingencies |
||||
|
Redeemable noncontrolling interest |
81,600 |
69,750 |
||
|
Canopy Growth Corporation shareholders' equity: |
||||
|
Common shares - $nil par value; Authorized - unlimited number of shares;Issued - 370,865,639 shares and 350,112,927 shares, respectively |
6,724,245 |
6,373,544 |
||
|
Additional paid-in capital |
2,520,371 |
2,615,155 |
||
|
Accumulated other comprehensive income |
152,415 |
220,899 |
||
|
Deficit |
(4,431,737) |
(4,323,236) |
||
|
Total Canopy Growth Corporation shareholders' equity |
4,965,294 |
4,886,362 |
||
|
Noncontrolling interests |
215,247 |
221,758 |
||
|
Total shareholders' equity |
5,180,541 |
5,108,120 |
||
|
Total liabilities and shareholders' equity |
$6,845,830 |
$6,857,745 |
||
Schedule 2
|
CANOPY GROWTH CORPORATION CONDENSED INTERIM CONSOLIDATED STATEMENTS OF OPERATIONS (in thousands of Canadian dollars, except number of shares and per share data, unaudited) |
||||
|
Three months ended June 30, |
||||
|
2020 |
2019 |
|||
|
Revenue |
$119,088 |
$103,391 |
||
|
Excise taxes |
8,672 |
12,909 |
||
|
Net revenue |
110,416 |
90,482 |
||
|
Cost of goods sold |
103,921 |
72,192 |
||
|
Gross margin |
6,495 |
18,290 |
||
|
Operating expenses: |
||||
|
Selling, general and administrative expenses |
135,392 |
145,647 |
||
|
Share-based compensation |
30,685 |
87,362 |
||
|
Asset impairment and restructuring costs |
12,794 |
- |
||
|
Total operating expenses |
178,871 |
233,009 |
||
|
Operating loss |
(172,376) |
(214,719) |
||
|
Loss from equity method investments |
(7,189) |
(1,833) |
||
|
Other income (expense), net |
48,205 |
32,768 |
||
|
Loss before income taxes |
(131,360) |
(183,784) |
||
|
Income tax recovery (expense) |
3,038 |
(10,267) |
||
|
Net loss |
(128,322) |
(194,051) |
||
|
Net loss attributable to noncontrolling interests and redeemable noncontrolling interest |
(19,821) |
(8,182) |
||
|
Net loss attributable to Canopy Growth Corporation |
$(108,501) |
$(185,869) |
||
|
Basic and diluted loss per share |
$(0.30) |
$(0.54) |
||
|
Basic and diluted weighted average common shares outstanding |
363,763,347 |
346,779,156 |
||
Schedule 3
|
CANOPY GROWTH CORPORATION CONDENSED INTERIM CONSOLIDATED STATEMENTS OF CASH FLOWS (in thousands of Canadian dollars, unaudited) |
||||
|
Three months ended June 30, |
||||
|
2020 |
2019 |
|||
|
Cash flows from operating activities: |
||||
|
Net loss |
$(128,322) |
$(194,051) |
||
|
Adjustments to reconcile net loss to net cash used in operating activities: |
||||
|
Depreciation of property, plant and equipment |
17,415 |
13,587 |
||
|
Amortization of intangible assets |
16,632 |
7,165 |
||
|
Share of loss on equity method investments |
7,189 |
1,833 |
||
|
Share-based compensation |
30,685 |
87,362 |
||
|
Asset impairment and restructuring costs |
12,794 |
- |
||
|
Income tax (recovery) expense |
(3,038) |
10,267 |
||
|
Non-cash foreign currency |
8,688 |
2,834 |
||
|
Change in operating assets and liabilities, net of effects from purchases of businesses: |
||||
|
Amounts receivable |
17,577 |
13,506 |
||
|
Prepaid expenses and other assets |
(16,059) |
(24,009) |
||
|
Inventory |
(10,772) |
(50,716) |
||
|
Accounts payable and accrued liabilities |
3,755 |
(12,582) |
||
|
Other, including non-cash fair value adjustments |
(75,090) |
(13,486) |
||
|
Net cash used in operating activities |
(118,546) |
(158,290) |
||
|
Cash flows from investing activities: |
||||
|
Purchases of and deposits on property, plant and equipment |
(61,547) |
(211,824) |
||
|
Purchases of intangible assets |
(3,088) |
(7,692) |
||
|
Proceeds on sale of intangible assets |
18,337 |
- |
||
|
(Purchases) redemption of short-term investments |
(382,486) |
687,818 |
||
|
Investments in equity method investments |
- |
(2,824) |
||
|
Investments in other financial assets |
(2,564) |
(29,414) |
||
|
Investment in Acreage Arrangement |
- |
(395,190) |
||
|
Recovery of amounts related to construction financing |
10,000 |
- |
||
|
Payment of acquisition related liabilities |
(4,511) |
(21,447) |
||
|
Net cash outflow on acquisition of noncontrolling interests |
(125) |
- |
||
|
Net cash outflow on acquisition of subsidiaries |
- |
(425,024) |
||
|
Net cash used in investing activities |
(425,984) |
(405,597) |
||
|
Cash flows from financing activities: |
||||
|
Payment of share issue costs |
(595) |
(74) |
||
|
Proceeds from issuance of shares by Canopy Rivers |
92 |
86 |
||
|
Proceeds from exercise of stock options |
4,722 |
16,077 |
||
|
Proceeds from exercise of warrants |
244,990 |
427 |
||
|
Issuance of long-term debt |
4,439 |
- |
||
|
Repayment of long-term debt |
(6,345) |
(98,207) |
||
|
Net cash provided by (used in) financing activities |
247,303 |
(81,691) |
||
|
Effect of exchange rate changes on cash and cash equivalents |
(30,079) |
(18,620) |
||
|
Net decrease in cash and cash equivalents |
(327,306) |
(664,198) |
||
|
Cash and cash equivalents, beginning of period |
1,303,176 |
2,480,830 |
||
|
Cash and cash equivalents, end of period |
$975,870 |
$1,816,632 |
||
Schedule 4
|
Adjusted Gross Margin1 Reconciliation (Non-GAAP Measure) |
|||||
|
Three months ended June 30, |
|||||
|
(in thousands of Canadian dollars, unaudited) |
2020 |
2019 |
|||
|
Net revenue |
$110,416 |
$90,482 |
|||
|
Gross margin, as reported |
6,495 |
18,290 |
|||
|
Adjustments to gross margin: |
|||||
|
Charges related to the flow-through of inventorystep-up on business combinations |
1,213 |
- |
|||
|
Adjusted gross margin1 |
$7,708 |
$18,290 |
|||
|
Adjusted gross margin percentage1 |
7% |
20% |
|||
|
1 Adjusted gross margin and adjusted gross margin percentage are non-GAAP measures. See "Non-GAAP Measures". |
|||||
Schedule 5
|
Adjusted EBITDA1 Reconciliation (Non-GAAP Measure) |
||||
|
Three months ended June 30, |
||||
|
(in thousands of Canadian dollars, unaudited) |
2020 |
2019 |
||
|
Net loss |
$(128,322) |
$(194,051) |
||
|
Income tax (recovery) expense |
(3,038) |
10,267 |
||
|
Other (income) expense, net |
(48,205) |
(32,768) |
||
|
Loss on equity method investments |
7,189 |
1,833 |
||
|
Share-based compensation2 |
30,685 |
87,362 |
||
|
Acquisition-related costs |
1,394 |
13,182 |
||
|
Depreciation and amortization2 |
34,047 |
20,752 |
||
|
Asset impairment and restructuring costs |
12,794 |
- |
||
|
Charges related to the flow-through of inventory step-up on business combinations |
1,213 |
- |
||
|
Adjusted EBITDA1 |
$(92,243) |
$(93,423) |
||
|
1Adjusted EBITDA is a non-GAAP measure. See "Non-GAAP Measures". |
||||
|
2 From Statement of Cash Flows. |
||||
Schedule 6
|
Free Cash Flow Reconciliation1 |
||||
|
Three months ended June 30, |
||||
|
(in thousands of Canadian dollars, unaudited) |
2020 |
2019 |
||
|
Net cash used in operating activities |
$(118,546) |
$(158,290) |
||
|
Purchases of and deposits on property, plant and equipment |
(61,547) |
(211,824) |
||
|
Free cash flow1 |
$(180,093) |
$(370,114) |
||
|
1Free cash flow is a non-GAAP measure. See "Non-GAAP Measures". |
||||
Contact: Laura Nadeau, Media Relations, media@canopygrowth.com; Judy Hong, Vice President, Investor Relations (USA), Judy.hong@canopygrowth.com; Tyler Burns, Vice President, Investor Relations (Canada), Tyler.burns@canopygrowth.com